There have been studies that investigated acoustic and articulatory consonant reduction in relation to the corresponding vowel reduction, but these were generally limited to only a few classes of consonants, with only limited speech material, e.g. [1, 4, 5, 6, 11]. From these studies it is difficult to discern the general effects of consonant reduction in "normal" speech situations.
        Velar   Pal     Alve    Lab
Plos    k g             t d     p b
Fric    x V     J S     s z     f v
Nasal   N               n       m
V-like  r       j       l ~     w
At the moment, any understanding of the way reduction affects the spectro-temporal structure of consonants and the way it influences consonant identification is seriously lacking. Therefore, it is difficult to point to specific features of articulation where reduction will affect the phonemic distinction of consonants. In this paper, we will limit ourselves to an inventory of consonant acoustics that parallel the vowel characteristics that are affected by vowel reduction. One important question that we want to answer is whether acoustic consonant reduction is indeed similar to vowel reduction.
Four aspects of vowels and consonants are studied to characterise consonant reduction:
- 1. Formant values
- 2. Duration
- 3. Center of Gravity of the spectrum (i.e., the "mean" frequency)
- 4. Sound energy difference between vowels and consonants
       Velar  Pal    Alve   Lab    Total
Plos   63            65     61     189
Fric   77     3      63     75     218
Nasal  14            72     63     149
V-lik  60     21     94     60     235
e
Total  214    24     294    259    791
2. MATERIAL AND METHODS
From the phonetic transcription, all Vowel-Consonant-Vowel (VCV) segments were located in the speech recordings (also those crossing word boundaries). 1847 VCV pairs had both realizations originating from corresponding positions in the utterances with identical syllable structure, syllable boundary type, and sentence and word stress. Of these VCV-pairs, 791 have been analyzed in detail for this paper (see table 1 and 2) and will be used here to study consonant reduction in more detail.
Phoneme boundaries were placed using a waveform display with audio feedback [2] combined with synchronized displays of the Harmonicity-to-noise ratio, total energy, and the spectral balance, i.e., energy in the high- (above 3 kHz) versus low- (below 750 Hz), high- versus mid- (between 750 and 3000 Hz), and mid- versus low-frequencies. In cases were none of the displays suggested a boundary, audio cues were used exclusively. The boundaries between vowels and consonants were placed preferably on waveform zero-crossings that corresponded to "visible" changes in the spectral composition of the waveform. If present, priority was given to spectral changes that indicated the start or end of a constriction (e.g., abrupt changes in the spectral balance). LPC formant tracks were extracted using the Split-Levinson algorithm (after down sampling to 10 kHz, using 5 pole zero pairs).
3. RESULTS
3.1. Formant values
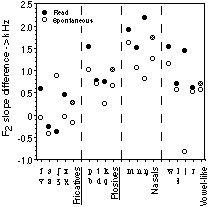
The formant transitions in the vowel off- and onset bordering a consonant, especially of the F2, are both sensitive to coarticulation and are important cues for consonant identification [3, 9]. To quantify the extent of acoustic coarticulation we determined the difference between the F2 slopes at the CV- and the VC-boundaries (i.e., the F2 slope difference). We used formant track slopes normalized for vowel duration because formant track shapes are largely invariant with speaking rate [10] and because in perception one also normalizes for speaking rate [8]. The slopes were calculated from the coefficients of a 4th order polynomial fit of the F2 tracks of the vowels with the duration normalized to 1.
For the fricatives and plosives, as well as for all consonants pooled (not shown), there is a statistically significant lower slope difference between speaking styles (p <= 0.001, two tailed Sign test). The behaviour of individual phonemes is very erratic (figure 2, none reaches statistical significance).
3.2. Duration
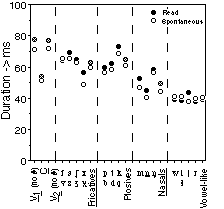
Both vowels and consonants become shorter when spoken spontaneously. Furthermore, they become shorter by the same amount. The relative duration of consonants in the VCV segments, i.e., as a fraction of the total, does not change when speaking style changes (not shown).
3.3. Center of Gravity
For Dutch (and English), a more level spectral slope, i.e., a higher COG, strongly correlates with perceived sentence accent [12, 13]. As the de-accentuation of vowels strongly correlates with vowel reduction, we can predict that reduction will show up as a lower COG. In figure 4 this prediction bears out for the vowel realizations. For each vowel, spontaneous realizations have a lower COG than the read realizations (only shown for pooled data). For the sonorants and fricatives we see a similar picture (a lower COG for spontaneous realizations). For the release bursts of the plosives we see an erratic behaviour that does not seem to indicate a definite difference in the COG with respect to speaking style.
Quite low COG frequencies are found for sonorants (vowels and consonants) with vowels having higher values than nasals and vowel-like consonants. For the latter, the COG is dominated by the damping of the higher frequencies due to their closed articulation.
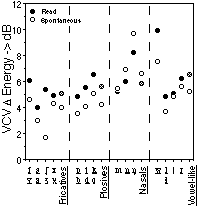
3.4. Intervocalic sound energy difference
Figure 6 displays the sound energy differences for read and spontaneous speech. For all consonants, except for the nasals, the intervocalic sound energy difference is smaller in spontaneous speech. Altogether, the effects of speaking style changes on the intervocalic sound energy differences seem to be small, on the order of 1 dB. Therefore, changes in the sound level of the vowels seem to be largely matched by corresponding changes in the intervocalic consonants.
4. DISCUSSION
The generally lower F2 slope differences in spontaneous speech indicate a decrease of coarticulation strength. This is equivalent to the spectral effect of articulatory reduction found in vowel space.
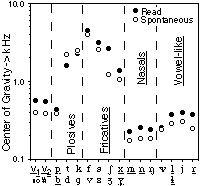
Except for the plosives, all consonants and vowels showed a decrease in COG. This indicates that both the vowels and the non-plosive consonants show a diminishing source strength in spontaneous speech. This in return, implies a decrease in vocal and articulatory effort. As the COG is strongly linked to the spectral slope at high frequencies, this lowering might be expected to correlate with a decrease in the perceived stress of the vowels and, if consonants contribute to stress perception, the consonants [12, 13].
In spontaneous speech, the nasal consonants "weaken" somewhat more than the neighbouring vowels whereas other consonants "weaken" somewhat less than the vowels (figure 6).
6. CONCLUSIONS
7. ACKNOWLEDGEMENTS
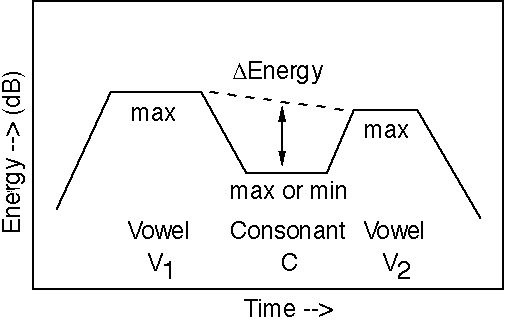
For plosives and fricatives:
 E = Vmax - Cmax , and for
 nasals and vowel-like consonants:
E = Vmax -
-
Cmin.
8. REFERENCES
- 1. Byrd, D. "Relations of sex and dialect to reduction", Speech Communication 15, 39-54, 1994.
- 2. Boersma, P. "Praat, a system for doing phonetics by computer" available at URL /.
- 3. Clark, J. and Yallop, C. An introduction to phonetics and phonology (Basil Blackwell, Oxford, UK), 116-151, 1990, 19952.
- 4. Duez, D. "On spontaneous French speech: aspects of the reduction and contextual assimilation of voiced stops", Journal of Phonetics 23, 407-427, 1995.
- 5. Farnetani, E. "The spatial and the temporal dimensions of consonant reduction in conversational Italian", Proceedings of Eurospeech 95, Madrid, 2255-2258, 1995.
- 6. Keating, P.A., Lindblom, B., Lubker, J. and Kreiman, J. "Variability in jaw height for segments in English and Swedish VCVs", Journal of Phonetics 22, 407-422, 1994.
- 7. Koopmans-Van Beinum, F.J. "The role of focus words in natural and in synthetic continuous speech: Acoustic aspects", Speech Communication 11, 439-452, 1992.
- 8. Miller, J.L. and Baer, T. "Some effects of speaking rate on the production of /b/ and /w/", Journal of the Acoustical Society of America 73, 1751- 1755, 1983.
- 9. O'Shaughnessy, D. Speech Communication (Addison-Wesley, Reading, MA), 1987
- 10. Pols, L.C.W. and Van Son, R.J.J.H. "Acoustics and perception of dynamic vowel segments", Speech Communication 13, 135-147, 1993.
- 11. Schmidt, A.M. and Flege, J.E. "Effects of speaking rate changes on native and non-native speech production", Phonetica 52, 41-54, 1995.
- 12. Sluijter, A.M.C. "Intensity and vocal effort as cues in the perception of stress", Proceedings of Eurospeech 95, Madrid, 941-944, 1995.
- 13. Sluijter, A.M.C. "Phonetic correlates of stress and accent", HIL dissertations 15, Ph.D. Thesis, University of Leiden, 1995.
- 14. Van Bergem, D. Acoustic and lexical vowel reduction, in Studies in Language and Language Use 16. Ph.D. Thesis, University of Amsterdam, 1995.
- 15. Van Son, R.J.J.H. Spectro-temporal features of vowel segments, in Studies in Language and Language Use 3. Ph.D. Thesis, University of Amsterdam, 1993.